NodeBalancer networking faults due to memory pressure
At around 14:30 UTC on Saturday 30th January we started experiencing networking issues at the LoadBalancer level between Cloudflare and our Kubernetes cluster. It seems that the misconfiguration was due to memory and CPU pressure.
This post-mortem is preliminary, we are still awaiting word
from Linode's SysAdmins on any problems they detected.
Update 2nd February 2021: Linode have migrated our NodeBalancer to a different machine.
 Leadup
List the sequence of events that led to the incident
At 14:30 we started receiving alerts that services were becoming unreachable. We first experienced some momentary DNS errors which resolved themselves, however traffic ingress was still degraded.
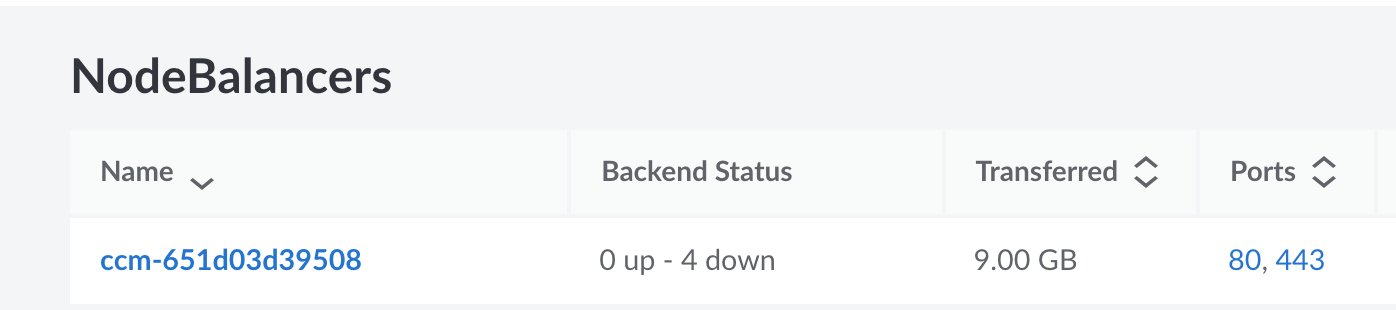
Upon checking Linode our NodeBalancer, the service which balances traffic between our Kubernetes nodes was reporting the backends (the services it balances to) as down. It reported all 4 as down (two for port 80 + two for port 443). This status was fluctuating between up and down, meaning traffic was not reaching our cluster correctly. Scaleios correctly noted:
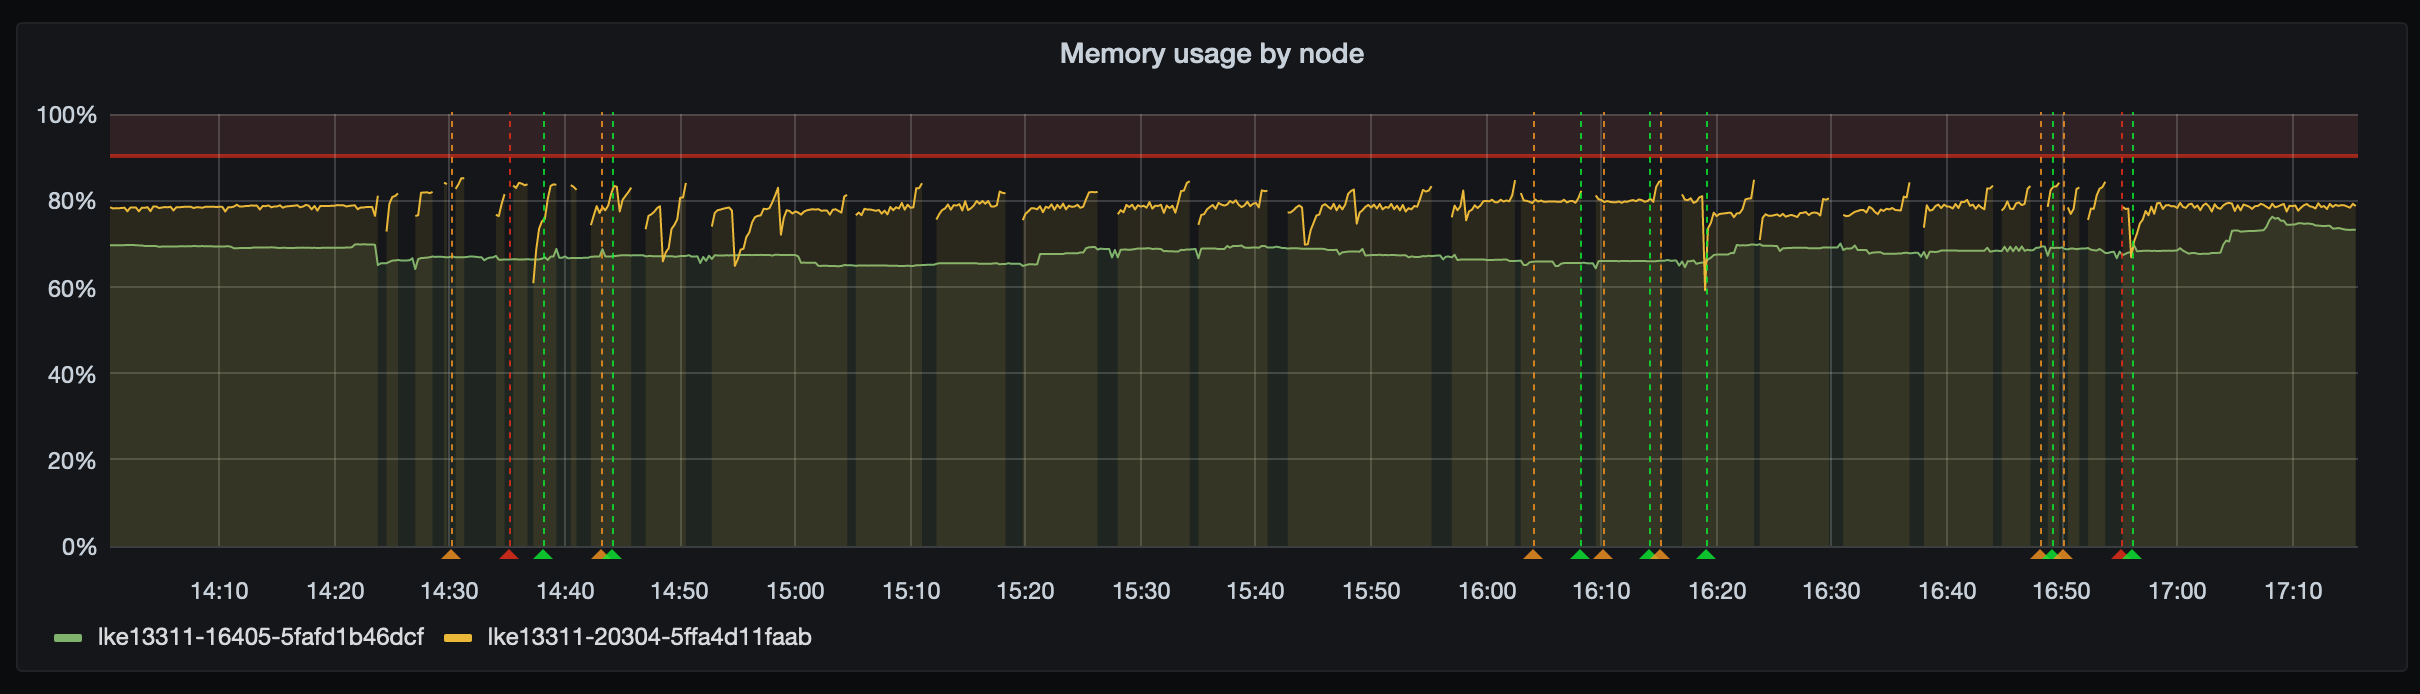
The config seems to have been set incorrectly due to memory and CPU pressure on one of our nodes. Here is the memory throughout the incident:
Here is the display from Linode:
 Impact
Describe how internal and external users were impacted during the incident
Since traffic could not correctly enter our cluster multiple services which were web based were offline, including services such as site, grafana and bitwarden. It appears that no inter-node communication was affected as this uses a WireGuard tunnel between the nodes which was not affected by the NodeBalancer.
The lack of Grafana made diagnosis slightly more difficult, but even then it was only a short trip to the Linode dashboard to diagnose and investigate.
 Detection
Report when the team detected the incident, and how we could improve detection time
We were alerted fairly promptly through statping which reported services as being down and posted a Discord notification. Subsequent alerts came in from Grafana but were limited since outbound communication was faulty.
 Response
Who responded to the incident, and what obstacles did they encounter?
Joe Banks responded!
Primary obstacle was the DevOps tools being out due to the traffic ingress problems.
 Recovery
How was the incident resolved? How can we improve future mitigation?
The incident resolved itself upstream at Linode, we've opened a ticket with Linode to let them know of the faults, this might give us a better indication of what caused the issues. Our Kubernetes cluster continued posting updates to Linode to refresh the NodeBalancer configuration, inspecting these payloads the configuration looked correct.
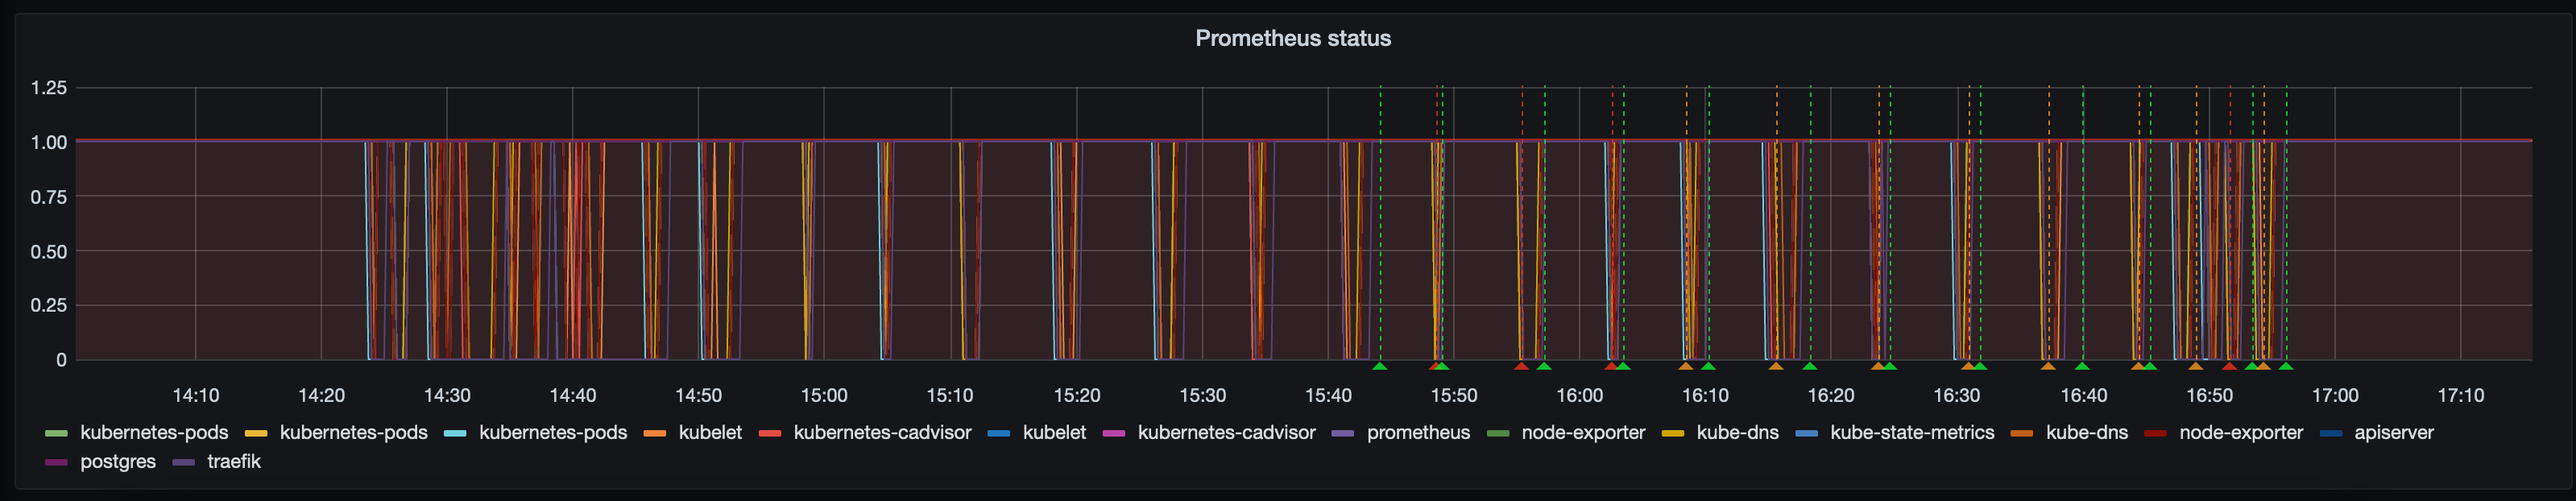
We've set up alerts for when Prometheus services stop responding since this seems to be a fairly tell-tale symptom of networking problems, this was the Prometheus status graph throughout the incident:
 Five Why's
Run a 5-whys analysis to understand the true cause of the incident.
What? Our service experienced an outage due to networking faults.
Why? Incoming traffic could not reach our Kubernetes nodes
Why? Our Linode NodeBalancers were not using correct configuration
Why? Memory & CPU pressure seemed to cause invalid configuration errors upstream at Linode.
Why? Unknown at this stage, NodeBalancer migrated.
 Blameless root cause
Note the final root cause and describe what needs to change to prevent reoccurrance
The configuration of our NodeBalancer was invalid, we cannot say why at this point since we are awaiting contact back from Linode, but indicators point to it being an upstream fault since memory & CPU pressure should not cause a load balancer misconfiguration.
Linode are going to follow up with us at some point during the week with information from their System Administrators.
Update 2nd February 2021: Linode have concluded investigations at their end, taken notes and migrated our NodeBalancer to a new machine. We haven't experienced problems since.
 Lessons learned
What did we learn from this incident?
We should be careful over-scheduling onto nodes since even while operating within reasonable constraints we risk sending invalid configuration upstream to Linode and therefore preventing traffic from entering our cluster.
 Follow-up tasks
List any tasks we should complete that are relevant to this incident
- Monitor for follow up from Linode
- Carefully monitor the allocation rules for our services